Finance Data Capstone Project is my own exercise project from Udemy Python for Data Science and Machine Learning Bootcamp by Jose Portilla. In this project, In this data project I will focus on exploratory data analysis of stock prices.
For this capstone project I will be analyzing stock prices data from Google Reader, unfortunately I can't access Google Reader from my computer, so I will use this data instead. This data contains stock information from following bank:
- Bank of America
- Citigroup
- Goldman Sachs
- JPMorgan Chase
- Morgan Stanley
- Wells Fargo
For each bank data contains the following fields:
- Open, double precision float
- High, double precision float
- Low, double precision float
- Close, double precision float
- Volume, integer
Project Intro/Objective
The purpose of this project is meant to practice my visualization and pandas skills, it is not meant to be a robust financial analysis or be taken as financial advice.
Project Library
- Numpy
- Pandas
- Matplotlib
- Seaborn
- datetime
- matplotlib.plyplot
- Plotly
- Cufflinks
Data and Setup
In this section, I want to show some of the data information, I will use .head() to see all dataset and Bank of America data (BAC).
Exploratory Data Analysis
From all banks data, I want to see the max Close price for each bank's stock throughout the time period.
Then I create a new empty DataFrame called returns. This dataframe will contain the returns for each bank's stock.
For further study, I can use pairplot to see how each bank performance related to each other:
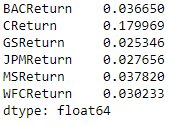
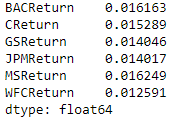
For better understanding, we look to all banks return data. We looking for minimum, maximum, and standard deviation from each bank.
Then I try to look for Morgan Stanley 2015 and CitiGroup 2008 distribution plot.
Data Visualization
In this section, I try to visualize some financial analysis. First, I have to import the required modules, then try to visualize close price for each bank for the entire index of time (2008 - 2016). First, I try to create simple line plot of all banks close price using for loop and .xs then try to see if there is any difference between this two plot.
I can see, using for loop and using .xs resulting the same plot, the difference is I can use shorter code while using .xs than using for loop.
After that, I create line plot using iplot, the difference is I can create an interactive graph while using iplot, where I can get the data directly when I move our cursor to certain line.
Then, I try to create a moving averages plot using rolling with window = 30 and create the corrleation data frame using Close price as key value.
After created correlation data frame, I try to plot HeatMap and ClusterMap using simple plot to makes easier for me to look the correlation between our data.
After created Heatmap using simple plot, I try to create Heatmap using iplot and see the difference.
The difference between simple plot and iplot is when using iplot, I can create an interactive plot where I can see the value for certain position using our pointer, and simple plot just showing the plot and does not create an interactive plot.
Furthermore, I try to create some advance financial analysis technic. I try to plot using iplot to get an interactive plot.
First, I create Bank of America candlestick for the year 2015. Using iplot and kind as 'candle', I get candlestick plot like this:
Second, I create Morgan Stanley simple moving averages for the year 2015. I use .ta_plot(study='sma') and periods [13, 21, 55]:
Third, I create Bank of America Bollinger Band Plot for the year 2015. I use .ta_plot(study='boll'):
Conclusion
- Google Reader performance varies within countries
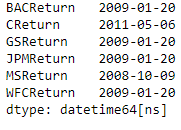
- Almost all banks sinks stocks on Inauguration Day (2009-01-20)
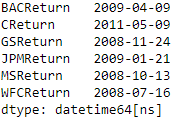
- Citigroup got minimum returns on reverse stock split day (2011-05-06)
- Simple line plot using .xs has shorter code than using for loop but got the same result
- iplot is more interactive than simple plot
- We can use .ta_plot() for some financial analysis
Additional Resources
- Header Backgrounds by Wallpaper Flare at wallapaperflare.com
- For further explanation regarding python code, please kindly check this link.